This page shows some of the loss curves and efficiency curves for the operating region of the motor.
An example motor is considered and solved using FEA for different speed and torque points to predict the losses using Bertotti loss model and LS loss model. The bertotti losses are used along with the magnet losses and the copper losses to predict the input and hence the efficiency of the motor.
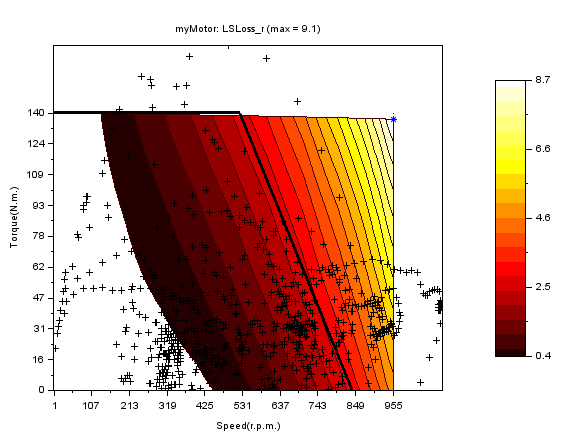
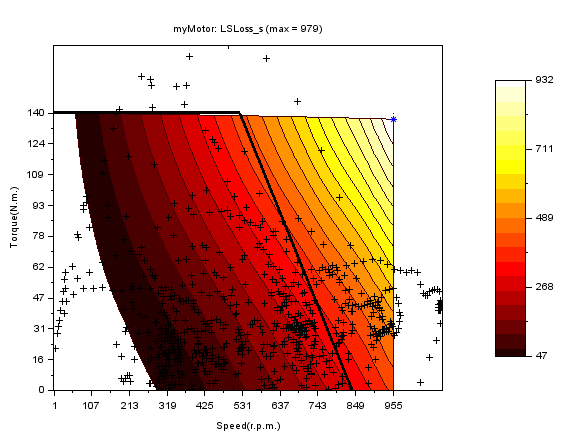
LS Loss model was just plotted to be able to compare with the bertotti losses.
Bertotti losses can be split into hysteresis losses, eddy losses and excess losses.
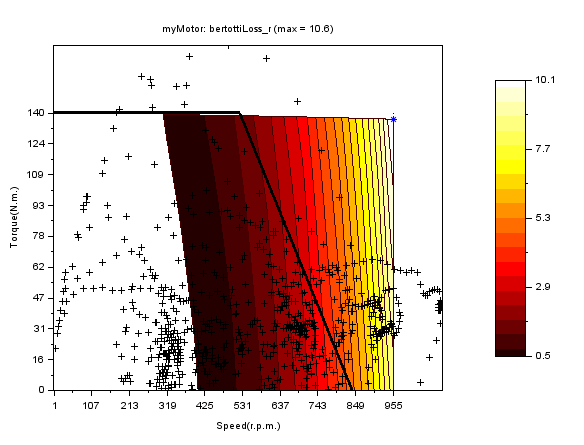
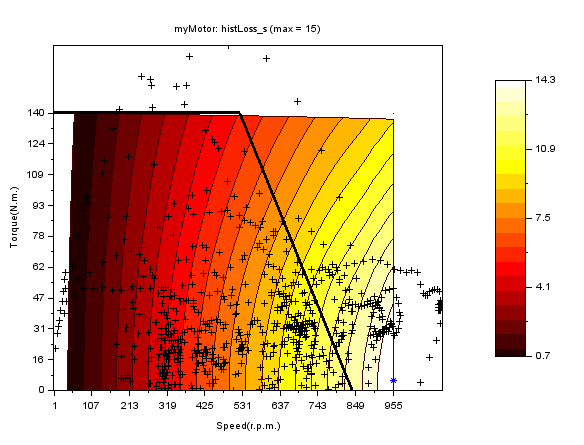
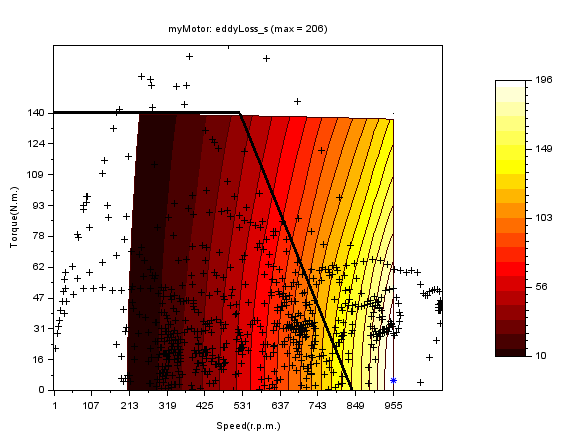
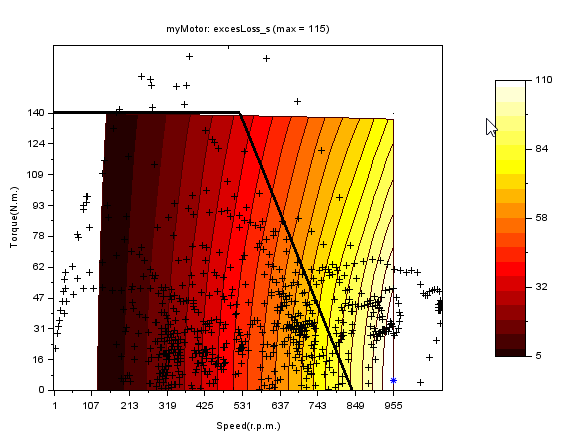
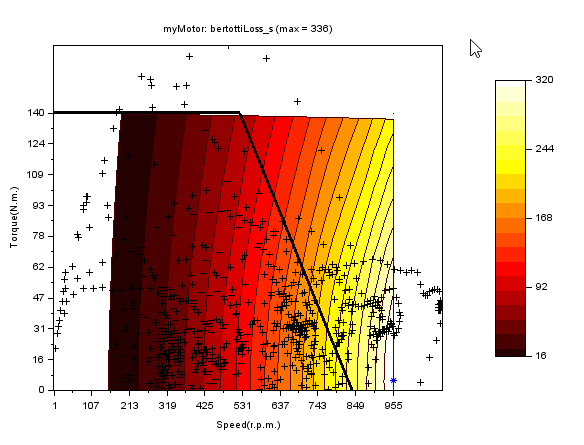
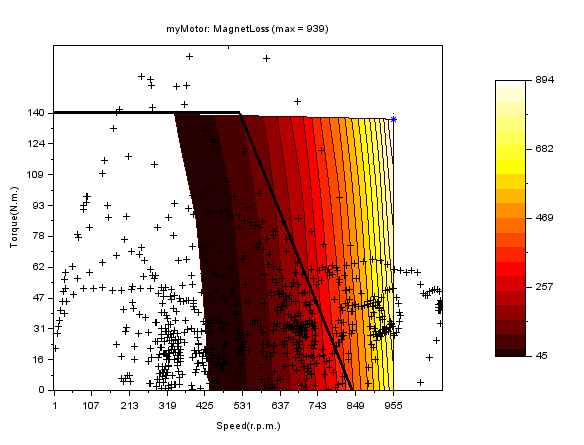
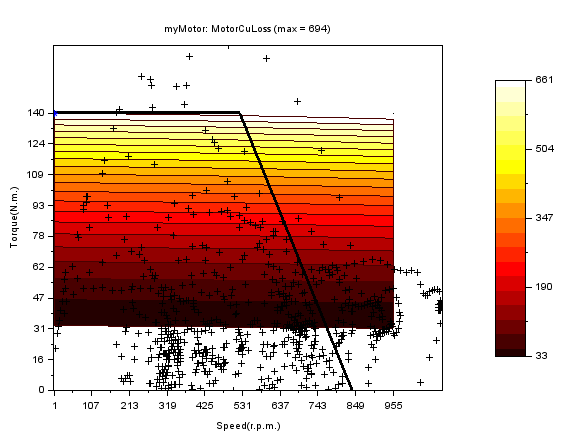
In each of the following images:
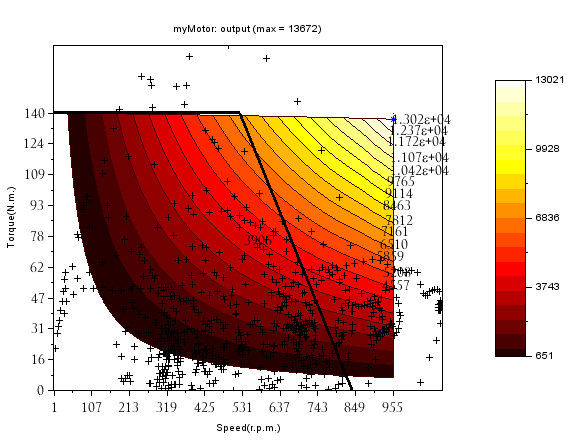
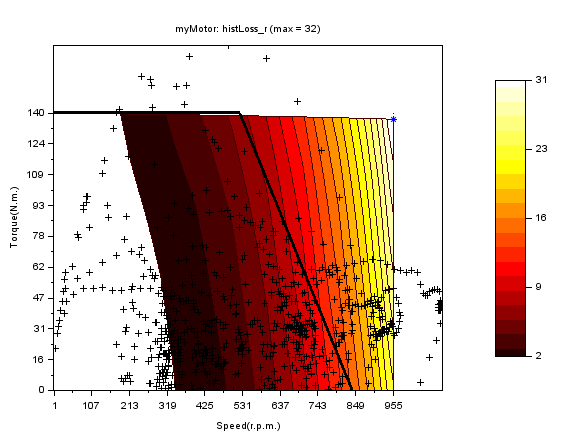
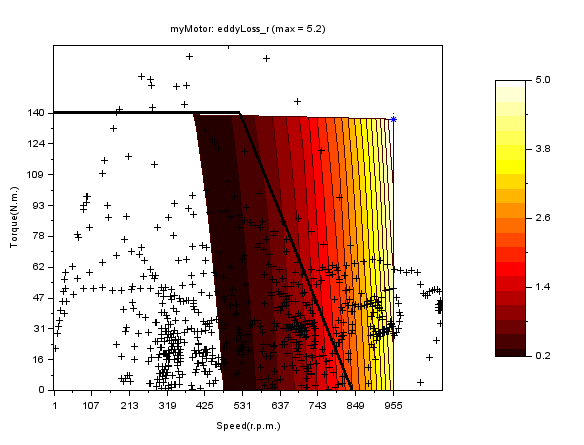
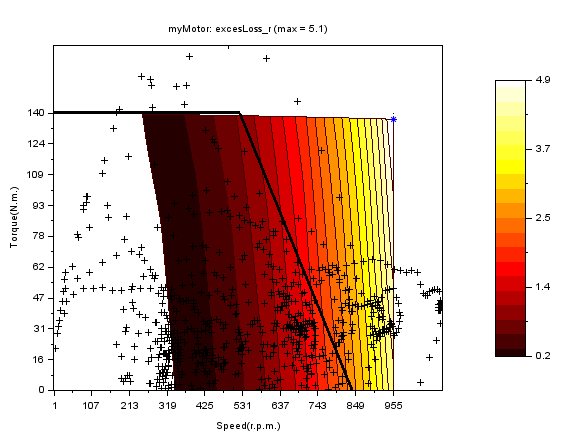
- the dark-thick line represents the speed-torque characteristic curve.
- the black + dots represent the operating points of the motor when used as a traction motor on a certain vehicle with a certain drive cycle.
- the blue * dot represent the peak of the corresponding map.
The following output map can be generated from the knowledge of speed and torque values.
The first component of bertotti losses in the rotor - hysteresis losses
The second component of bertotti losses in the rotor - eddy losses
The third component of bertotti losses in the rotor - excess losses
Total bertotti losses in the rotor
LS losses in the rotor - an equivalent of Bertotti losses, but calculated differently
The first component of bertotti losses in the stator - hysteresis losses
The second component of bertotti losses in the stator - eddy losses
The third component of bertotti losses in the stator - excess losses
Total bertotti losses in the stator
LS losses in the stator - an equivalent of Bertotti losses, but calculated differently
Losses in the magnet
Copper losses
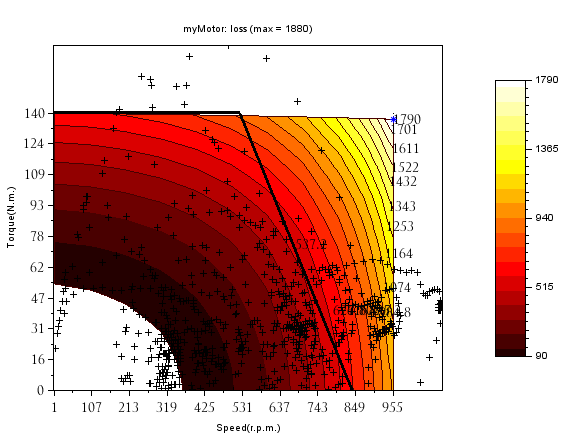
Total losses
Output + Losses = input
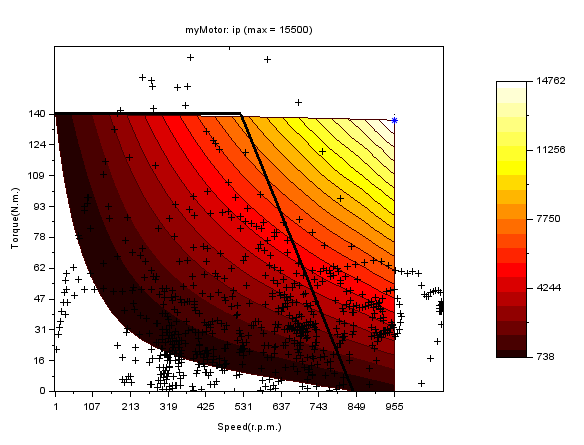
Predicted input
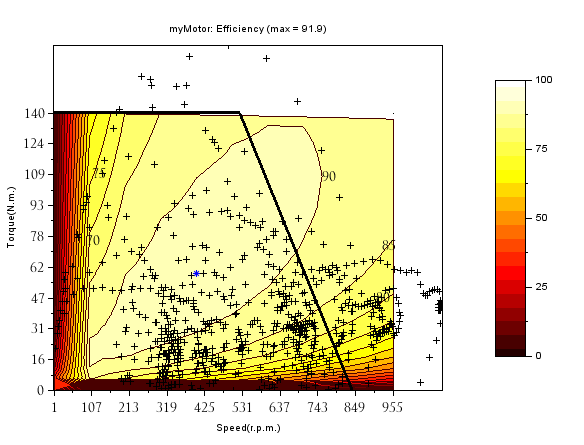
Now, the above efficiency map assumes a default material, and certain ideal processes. In reality, the losses may be more than predicted. It is recommended to use a factor of safety for the losses estimated while calculating the efficiencies.